
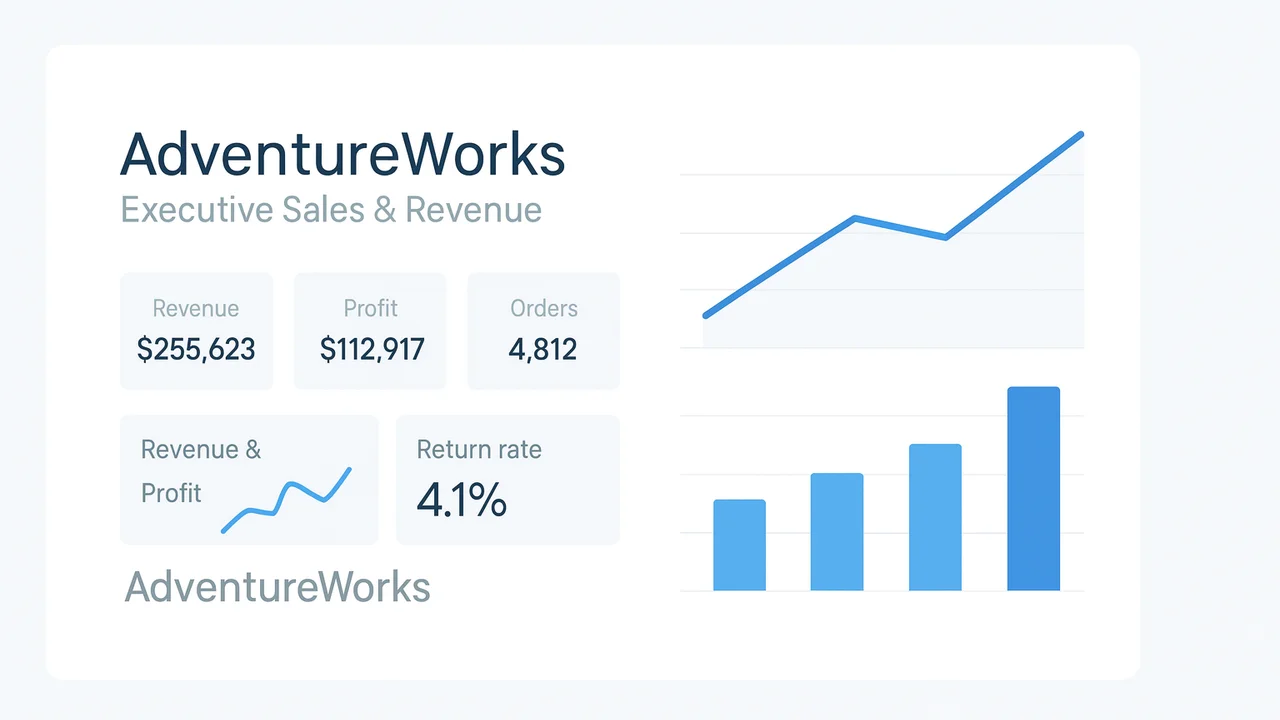
AdventureWorks — Executive Sales & Revenue (Power BI)
Interactive executive view of revenue, profit, orders, and return rate with drilldowns by category, product, and time.
Revenue & Profit
Orders
Return rate
Problem
Leaders needed a single, reliable view of performance with drilldowns for category, product, and time. Spreadsheets and ad-hoc requests slowed decision cycles and produced inconsistent numbers.
Data and Sourcing
- Sample dataset: AdventureWorks (sales, product, category, territory, returns).
- Star schema: FactSales + Product, Category, Date, Territory, Returns.
- Refresh: scheduled in the Power BI Service for predictable availability.
Approach
- Power Query for typing, cleanup, and conformed dimensions.
- DAX measures for revenue, profit, orders, return rate, YoY/rolling trends.
- Bookmarking, drillthrough, and slicers for fast executive exploration.
Results and Impact
- Executives review revenue, profit, orders, and returns in one place.
- Shared metric definitions reduce one-off BI requests.
- Drilldowns by category/product expose drivers and outliers quickly.
What I Did
- Modeled the star schema and authored the DAX measure library.
- Defined metric governance (revenue, profit, orders, returns).
- Designed executive UX; published and embedded for the web.
Stack
Power BI
Power Query
DAX
Publish to Web